


BUYING BACK STOCK AT ANY PRICE – WHAT SEVEN AND A HALF YEARS OF RESTAURANT BUYBACKS INFORM US ABOUT MULTIPLES AND DEBT
THE SHORT VERSION
From fiscal 2019 through June 2026, 23 public restaurant companies spent $65.6 billion buying back their own stock. We went through every 10-K, and the 2026 10-Qs, to see what they paid, where the money came from, and what those shares are worth today.
Two lessons stand out.
First, the absolute price matters. Eight companies paid roughly 18 times EBITDA or more for their stock. Not one of them did better than an investor who put the same dollars into the S&P 500 on the same days. Half of them are under water, with the stock they purchased now selling at a lower price than paid. We describe just below, how the price paid affects the result. Importantly, the capital used to buy stock should not preclude other corporate uses, such as building more stores, which presumably could be contributing even higher cash on cash returns. It is also worth noting that, while there are practical limitations to the rate of growth for company operated locations, there is no similar limitation to shrinking the capitalization, as long as the capital is available for both purposes.
Second, borrowing to buy back stock can turn an ordinary slowdown into lasting damage. The five worst results in the group all borrowed between 38% and 70% of what they spent. When their businesses stumbled, the debt stayed but the dividends remain. Why buy stock when the company fundamentals are questionable (or worse) and the stock is most likely to be priced lower in the foreseeable future. Wait for ‘stability’, at least.
HOW WE MEASURE IT
For each company we took the cash it spent on buybacks each year and the shares it retired, which gives the price it actually paid. From there we worked out three things:
- What it paid. Buying stock at 20x the current rate of corporate EBITDA generates a 5% “gross” immediate return on capital, less what the capital would have safely earned pretax, reducing to a “net” net cash on cash return. At twenty times EBITDA, with short term treasury bill rates of 4 or 5 percent, the incremental net return is immaterial. At 5x EBITDA, the 20% gross C/C return would generate an incremental net return closer to 15”%, obviously still worthwhile, which would grow in future years if the business expands. At 8x EBITDA, the 12.5% gross return produces perhaps 8% net, which can grow and is still worthwhile, as long as the capital is available. At more than 40x EBITDA, we don’t know what Wingstop was thinking.
- The full-year data runs through fiscal 2025 (fiscal 2026 for Darden, Brinker and Cracker Barrel, whose years end in mid-2026. We left out four micro-caps and Dine Brands, which has no usable EV/EBITDA figure, leaving 18 companies.
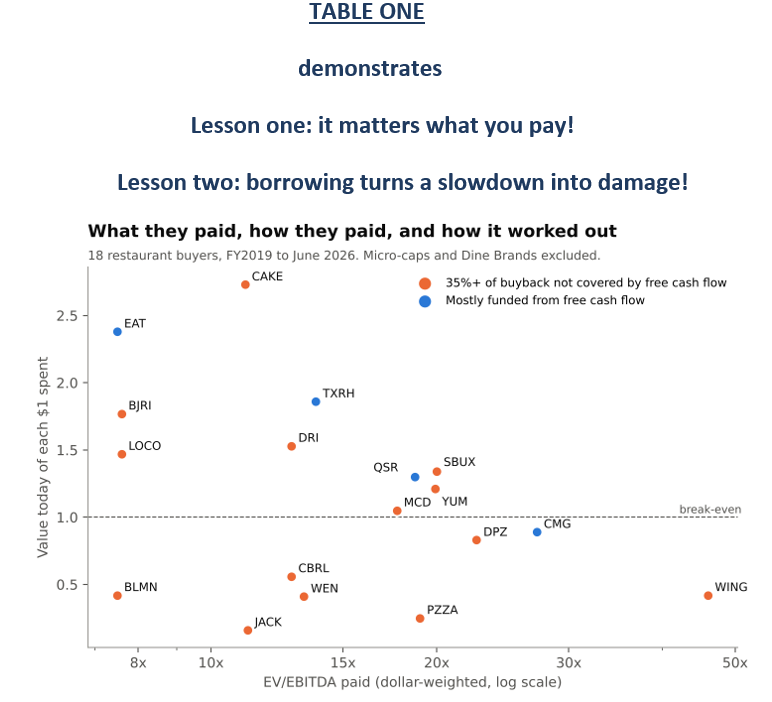
Fourteen of the 18 companies borrowed for 35% or more of their buybacks. Versus the S&P index, the median result for that group is $0.94 per dollar spent and only one beat the index. The reason is simple. When a company borrows to buy back stock, it swaps debt that costs money every year for a share of future cash flow. If the yield it buys is no higher than its cost of borrowing, there is no cushion and the return depends on the business continuing to grow. Examples include widely different companies such as: Wingstop, who paid over 40x EBITDA and its funded debt went from $478 million to $1.2 billion and Papa John’s, which paid about 18x EBITDA while adding $242 million of debt. When the business slows, the problems pile up. Cash from operations goes to interest and the dividend often s is reduced or eliminated entirely. The suffering Company finds that they are out of buying power just as the stock is least expensive.
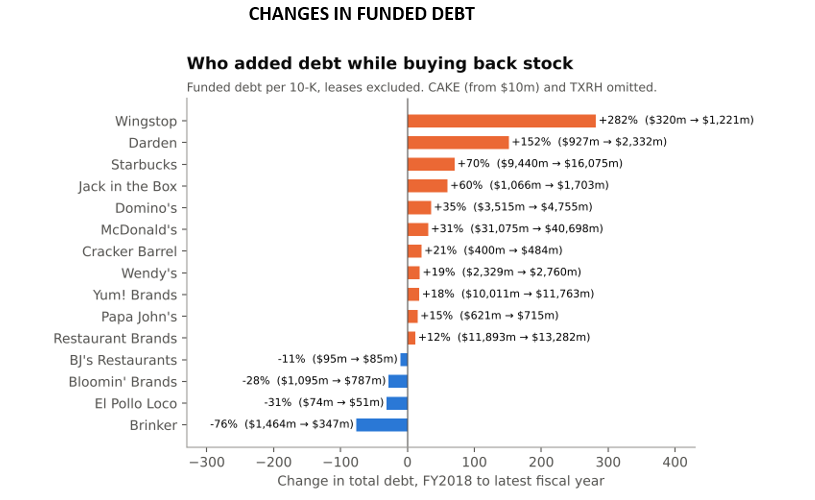
The following discussion describes how growing franchisors can tolerate more leverage than companies depending on capex to grow. Wingstop and Domino’s, while paying (in retrospect) more than they should have, to buy back stock, can grow out of the debt and interest expense. Papa John’s and Jack in the Box, coping with stagnant sales, royalties, and cash flow, have run out of borrowing (and purchasing) power. Too often the borrower has used up their borrowing power long before the business (and the stock) has bottomed.
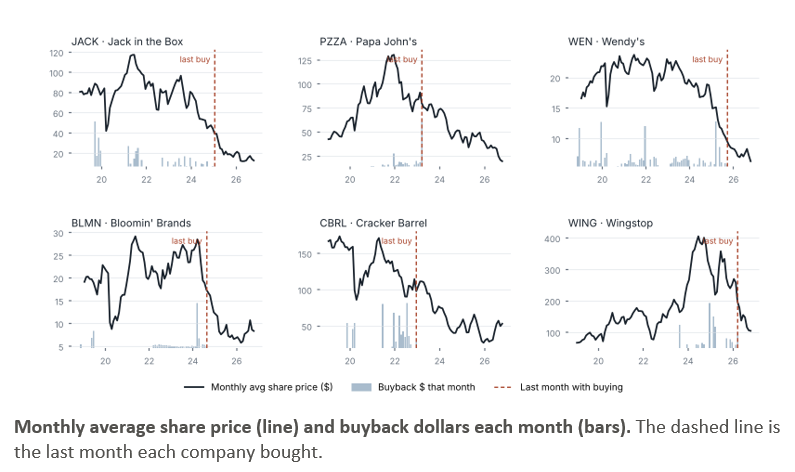
The following charts show how JACK, PZZA, WEN, BLMN, CBRL & WING used up their borrowing power far too soon. Five of the six have stopped buying, all at prices far above where their shares trade now. Papa John’s now trades at about 8 times EBITDA, less than half the 19x it paid. Jack in the Box is at 7.5x. This is the point at which a buyback would finally earn a decent return, and the debt taken on earlier is what keeps them from making it. Wingstop’s last purchases in March 2026 were still at about twice today’s price. WING, even now at an EBITDA multiple in the high teens, is not a great bargain, but the likely future growth provides at least a reasonable rationale.
FOUR CASE STUDIES
Wingstop: the Richest Price, Mostly Borrowed
Wingstop raised securitized debt four times: $551 million in 2018, $496 million in 2020, $250 million in 2022 and $500 million in December 2024. Over 2018, 2020 and 2022 it paid out $496 million in dividends, mostly specials. Then, from 2023 to 2025, it spent $662 million on its own stock at almost 48 times EBITDA, and 69% of that was not covered by free cash flow. The company justified its borrowing in its fiscal 2025 earnings release by saying that the December 2024 securitization, which added $500 million of debt, was done “to support our return of capital strategy.” It’s easy in retrospect to suggest that even more should have been paid out to shareholders or build more company operated stores, because domestic comps fell 3.3% in 2025, 5.8% in the fourth quarter and 7.5% in the second quarter of 2026. In July, 2026, the company guided to a 4% to 6% decline for the year. Debt is $1.2 billion and the stockholders’ deficit is $737 million. Even so, it bought another $79 million of stock in February and March 2026, at about 30 times EBITDA and mostly with money free cash flow didn’t cover. Altogether, the shares it bought are down 58% from what they paid, amounting to a far from trivial $384M.
Jack in the Box: the Worst Result in the Group
Jack in the Box spent $683 million on buybacks, a bit above its own median multiple, with 38% not covered by free cash flow. It also borrowed to buy Del Taco for $575 million in 2022.
By April 2025 the strategy had come apart. The company dropped its dividend “effective immediately,” announced 150 to 200 closures and put Del Taco up for sale. It wrote off $163 million of goodwill and intangibles in fiscal 2024 and $210 million in fiscal 2025, then sold Del Taco for $115 million and used the proceeds to retire securitized notes. Total debt rose from $1.07 billion in 2018 to $1.70 billion. The shares it bought are worth $0.16 per dollar spent, a “loss” of $574M. You would not call the JACK Board of Directors good traders.
It did not matter that JACK only paid a bit over their typically low multiple because the earnings and cash flow were coming down, so the apparently inexpensive stock price was about to decline a lot further.
Papa John’s: 19x, Two Thirds Borrowed
Papa John’s spent $407 million in fiscal 2021 to 2023 at about 19 times EBITDA, paying about 7% more than the average share price in the years it bought. About two-thirds was not covered by free cash flow. Its debt more than doubled, from $350 million to $764 million. In fiscal 2022 and 2023 alone it bought $335 million of stock against $156 million of free cash flow and covered the gap with $274 million of revolver borrowing.
In March 2026 a take-private bid at $47 a share was reported, but the potential acquiror did not follow through. In August the board ended an 18-month strategic review without a sale and suspended the dividend. The shares it bought are down about 75% from their cost, a material $302M.
Starbucks: the Same Mistake, at Scale
Starbucks spent $18.2 billion on buybacks at about 20 times EBITDA, $10.2 billion of it in fiscal 2019 alone. Eighty percent was not covered by free cash flow. Debt went from $3.9 billion in fiscal 2017 to $16.1 billion, and shareholders’ equity went from a positive $5.45 billion to a negative $8.1 billion. Annual cash interest rose from $97 million to $588 million.
Buybacks stopped twice: when Howard Schultz returned in April 2022, and again during the current turnaround. The shares are higher by 34% of their cost, so their timing versus the fundamentals was not as disastrous as the others. Starbucks didn’t lose money on its buybacks, but its shareholders would have done far better with the S&P index and the potential benefit has yet to be realized.
Inexpensive Valuation is not Sufficient if Fundamentals are Deteriorating
Two companies bought at relatively modest multiples and still did badly. Cracker Barrel borrowed 82% of its $239 million at about 13x, then cut its dividend by about 80% in 2024 to pay for a remodel program. Bloomin’ Brands bought at 7.5x, but did its largest buyback in 2024, 25% above that year’s average price. That year it bought $266 million of stock against $7 million of free cash flow and borrowed about $330 million on its revolver. It suspended its dividend in October 2025. Cracker Barrel’s shares are currently down 44% from their cost and Bloomin’ Brands has lost 58% at this level.
The Exceptions, and What They Tell Us
Leverage isn’t automatically fatal. Cheesecake Factory borrowed 38% of its buybacks and is up 173% from their cost because it bought at about 11x and the business improved. Darden, BJ’s and El Pollo Loco also borrowed and came out above water. Borrowing doesn’t guarantee a bad outcome, but it decreases the margin for error. Restaurant Brands, Yum! and McDonald’s all paid 18 to 20 times EBITDA and still show gains on their purchased stock because the business held up, though each could have done better in the S&P average.
While franchisors’ business model, generating presumably stable and (hopefully) growing free cash flow deserves a premium valuation, the “yield” on the buyback should still make sense versus alternative use of capital. Growth can bail out the apparently high valuation, but Wingstop buying back stock at 40x, yielding nothing on a net basis (2.5% minus foregone alternative return) requires above average growth over many years before the yield on the capital outlay justifies the expenditure. Forgive us for suggesting that even a franchising company that is currently “blowin’ and goin’” (e.g. Wingstop) eventually has a challenging year or two.
Just One Outstanding Success Story
One of the best results in the group came from the simplest approach. Brinker fixed its balance sheet first, bought its stock when it was cheap, and improved the business. Its buybacks are worth $2.38 per dollar spent and EAT is up 5x in the last five years.
Results and Conclusions
When a restaurant company announces a buyback, five questions are worth asking:
- What operating-cash-flow (EBITDA) yield is it buying at today’s price? Compare it with the company’s after-tax cost of debt or a safe return on unleveraged cash. If the two are close, the buyback is a bet on growth, not a return oF excess cash to anyone.
- Is it leveraging the balance sheet beyond a relatively safe level of 2-3x annual EBITDA. Beyond that provides the risk that a general business downturn will creative a serious strain within currently comfortable banking relationships.
- What is the realistic, probable, business outlook. If “stability”, at the least, is not in the cards, the stock is likely to trade lower rather than higher, and, a risk/reward analysis will suggest waiting. It is more than embarrassing for a Board of Directors, with the best of intention regarding Allocation of Capital, to have ‘pissed away’ hundreds of millions of dollars. In the worst of circumstances, a long term ‘workout’ can replace a ‘cash cow’.
Prepared by Roger Lipton and Tim Heitman