


We present below a copy of our November 1st letter to the gold mining focused Limited Partnership that we have long managed.
Memo to: Investing Partners November 1, 2026
The financial news of the month revolved around the direction of interest rates, presumed to be under the strong influence of the Federal Reserve, though that assumption is increasingly questionable. Rates moved higher most of the month, so bond prices were down, and, combined with the late month dramatic fall in the AI related hyper-scalers, gold related assets gave ground as well. Gold bullion had the worst month in years, down7.1% and our portfolio was down 15.3%. For the year to date, gold bullion is now down 10.2%. Our portfolio is down a touch less year to date, 9.4%, which is tolerable, considering that our portfolio has still tripled over the last twenty four months. No doubt we are invested in a volatile asset, but we consider this year “the pause that refreshes”.
The bullet points below show how the USA cost of food, energy, healthcare costs and education have changed in the last fifty years. A similar chart over 20, 100, 200 or 2,000 years would illustrate the same point, gold’s long-term ability to protect one’s purchasing power.
In 1977 a Big Mac costs $0.82. Today it averages $6.72. – up 8x
In 1977 a gallon of regular gas cost $0.66. Today it averages $4.63. – up 7x
In 1977 the average US family spent $1.0k on healthcare costs. A family plan today is $28k.-28x
In 1977 tuition at New York University was $3,550. Today it is $68,500. – up 19x
Gold bullion has gone from $148 to $4,000 per oz., up 28x.
We believe our conclusions are soundly based, based on everything we know about business history and human nature. We provide below a summary of US business history since the 1920s, showing the relentless inflationary trend, and the accompanying equally persistent deficit spending as a percent of GDP. The most basic law of supply and demand dictates that if currency grows faster than products and services, prices will adjust higher over time. We therefore believe that, as shown in Appendix I below, government deficit spending, compared to GDP was a major contributor to past inflation and is equally relevant going forward. We expect that the relentless inflation over the last 114 years (since the Fed was established in 1913) and especially since 1971, when Richard Nixon eliminated the US Dollar’s convertibility into gold, will continue indefinitely.
The argument as suggested by Appendix I, from 1920, could as well go back 2000 years to ancient Rome, when their economy was undermined by debasing of their silver backed Denarius currency. A bit more recently; in 1792 US Treasury Secretary, Alexander Hamilton, implemented the Coinage Act, establishing gold and silver as the only legal tender. Between 1792 and 1913, when the Federal Reserve was established, to smooth economic cycles and control inflation, including temporary price spikes during the War of 1812 and the Civil War, the US GDP grew at a real rate of about 4%, with virtually no inflation. Appendix I documents how fruitless the government’s intervention has been. This historical review shows that more damage than support has inevitably been provided, though it sometimes takes years for cause and effect to take place. A summary takes us from the early 1920s, when Calvin Coolidge allowed the recovery to adjust on its own, through the1929 stock market crash, FDR’s New Deal, to post Bretton Woods’ relatively prosperous period through the late 40s, 50s and mid-60s, to the deficit spending and rapid inflation of the 1970s, the relatively prosperous period with less government over-reach from most of the 1980s into the mid-90s, the resumption and escalation of government “support” from the late 1990s through the dotcom bust, the Great Recession of ’08-‘09, Covid in ’20-‘21 and the currently appearing distortions resulting from the misallocation of resources during the last two decades.
There is a great deal of information provided below. Its consideration provides comfort to us, hopefully to you as well, as we continue down our chosen road to protect the purchasing power of our liquid assets.
Sincerely
Roger
P.S. Over 100 years average CPI over 10-year periods was down only once, -2.0% in the 1930s. Deficit spending has been relentless over more than 50 years, the only exception being ’99-’01 with a modest total surplus of under $800B. What is the likelihood that we can make a serious dent in the current $40 TRILLION (excluding entitlements).
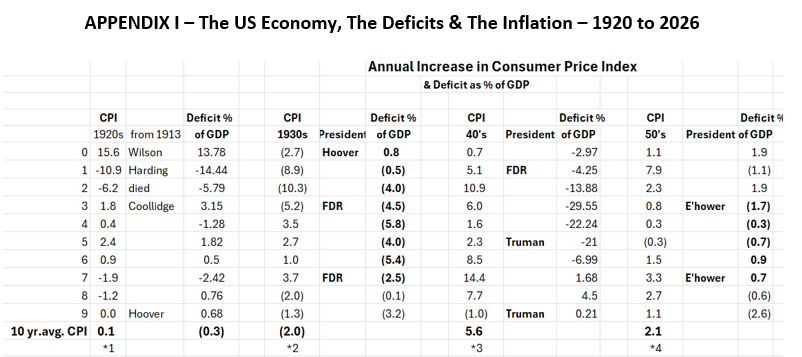
*1 – 1920s opened with lingering WWI inflation. Fed raised rates aggressively, triggering deflationary depression. Harding & Coolidge slashed WWI debt, did not spend, allowing economy to respond naturally. Economy picked up, mutated into speculation, 90% margin buying of stocks. Fed raised discount rate in 1929, triggering stock market crash and the Great Depression.
*2 – 1930s included depression, GDP plunging 29-30% between ’29 and ’33. Fed allowed M2 TO shrink by one third. 7-9000 banks failed (one third of banking system). FDIC bank insurance and Social Security put in place. FDR’S New Deal helped but secondary recession in ’37-’38 hurt. Unemployment still 17% in 1939, wartime government spending helped economy but full recovery was delayed until WWII ended.
*3 – 1940s characterized by WWII, a broad price freeze in 1941, with rationing of items such as meat, gasoline and tires. Post WWII, when product and price controls ended, inflation spiked to over 14% in 1947. Federal spending peaked at over 20% of GDP. Total Debt to GDP. 40% before WWII, peaked at 119% in 1946. The Bretton Woods System of 1944 established the US Dollar as the world’s reserve currency, with the US expected to control spending, protecting the Dollar’s value with gold convertibility.
*4 – The 1950s was a period of strong post-war economic expansion, low inflation (outside of an initial spike tied to the Korean War) and generally disciplined federal budgeting punctuated by minor recessions.
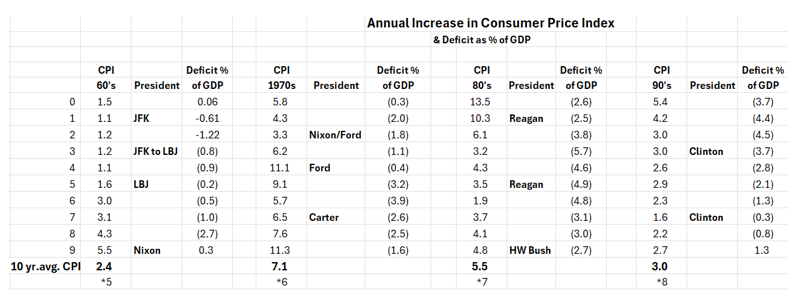
*5 – 1960s continued the productive expansion of the 1950s, until increased spending for the Vietnam War and LBJ’S Great Society set the stage for deficits. By the end of the 1960s, investors worldwide and governments were redeeming their US Dollars for gold, anticipating the operating and trade deficits of the 1970s.
*6 – 1970s provided the well documented stagflation. Between 1969 and 1971 US gold reserves were reduced from over 20,000 tons to the 8,400 tons that the US holds today. Government intervention created additional distortions, by way of price controls in the mid-1970s and again, relative to Oil in t979. Fed Chairman, Paul Volcker, hired by Jimmy Carter, was backed by Ronald Reagan as he raised interest rates sharply to reduce inflation. As inflation peaked in the late 1970s, gold peaked at $850/oz. in January, 1980.
*7 – The 1980s in the US provided a dramatic transition from severe stagflation to a multi-year private-sector expansion. This transformation was driven by tight monetary policy and fiscal policies under the Reagan administration. Consumers paid a price, however, with a brief economic contraction in 1980, followed by a much harsher recession, peaking with unemployment at 10.8% in late 1982. Beginning in 1983, the U.S. entered a prolonged period of GDP growth, job creation, and lower inflation, laying the groundwork for a long expansion that extended into the 1990s.
*8 – The 1990s started with a ’90-’91 eight-month long recession, triggered by a real estate and savings & loan crisis coupled with an oil price shock from the Gulf War. From mid-1991 through the rest of the decade, 3-4% GDP growth, with unemployment dropping from 7.5% to about 4%, was accompanied by 2.5-3.0% inflation. Overseen by Fed Chairman Alan Greenspan. President Clinton, encouraged by Republican leader, Newt Gingrich’s “Contract with America”, reduced spending and produced the first of the only three US spending surpluses in over 50 years. The late 1990s included the dotcom speculative boom.
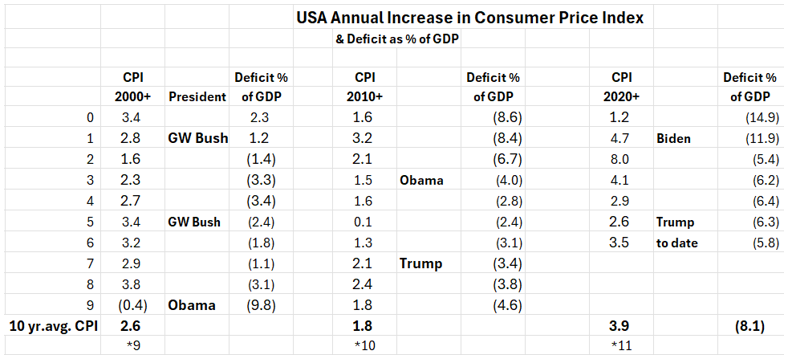
*9 – The 2000s, through 2009 have been characterized as the “lost decade”, marked early by the bursting of the dotcom bubble, wars in Afghanistan and Iraq, and the Great Recession from ’08 to ’09. After two surplus years in ’00 and ’01, the deficits that have prevailed over more than 50 years returned in record breaking amounts. Alan Greenspan’s relatively mild accommodation to deal with the dotcom bust, two wars, and concern over Y2K supported the economy until the ’08-’09, when suppressed interest rates and quantitative easing took center stage, providing the enormous fuel for the inflation to come.
*10 – The period from 2010 to 2019 was marked by recovery from the Great Recession, controlled inflation and historically low unemployment. Also featured, however, was unprecedented Federal Reserve accommodation, allowing for national debt and deficits, along with interest rates suppressed to record low levels. It seems clear at this point that “misallocation of resources” from that period will require an extended “cleansing” period.
* 11 – From 2020 to 2026, we have witnessed the disruption from the pandemic, ongoing massive fiscal and monetary stimulus, a surge of inflation, and interest rates moving back to more normal historical levels. Deficits and Cumulative Debt has moved to new high levels, and government policy seems unlikely to solve the problems that have built over decades. Both political parties, while providing lip service to reducing deficits, show no signs so far in meeting the necessary challenges.