



SIMILARITIES AND DIFFERENCES (As Shown in Charts Below)
Similarities:
Both stocks went to initial premiums.
Both concepts are double drive thru kiosks, selling hot and gold energy drinks.
Both are generating positive same store sales trends, generally mid-single digits. BROS had a breakout quarter in Q1’24 with a “10” SSS print, perhaps helped by an easy comparison. BRCB has had a similar “10” print most recently, likely helped by admittedly heavier promotional effort.
Both are generating store level EBITDA around 30%.
Both are generating revenue from Loyalty programs in the high 60s.
Both are growing company operated units at about 20% annually.
Both are debt free and able to sustain expansion rates from internally generated cash flow.
Distinctions:
BROS is much larger (about 1000 units systemwide vs. 158 at BRCB).
BROS locations have no indoor seating, whereas 75% of BRCB locations provide gathering places in the Starbucks mode.
BROS has much higher AUVs ($2.0M vs $1.2M at BRCB)
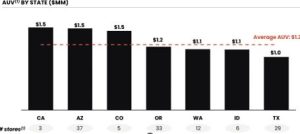
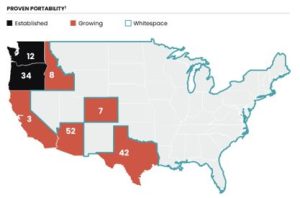
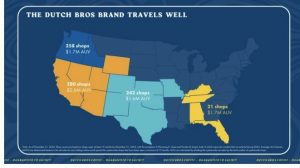
BROS has demonstrated success much more broadly. The charts below show: BRCB’s heaviest densities are Arizona (with 37 stores at $1.5M AUV), Oregon (with 33 stores at $1.2M), Texas (with 29 stores at $1.0M) and Washington (with 12 stores at $1.1M). DUTCH BROS shows no major region with AUVs under $1.6M with an AUV of $2.6M in a Western region, where BRCB shows 52 locations in AZ and 3 locations in CA at $1.5M.
BRCB is entirely company operated, where BROS (while expanding almost entirely with company stores) is about 30% franchised.
BROS demonstrates about a 30%-unit level C/C return, while BRCB quotes a targeted 40% C/C return. BROS has been investing far more in facilities (approaching $2M/unit), on leased land, while BRCB is far more leveraged by way of a build-to-suit structure, investing $600k (plus $100k pre-opening). (see chart below with higher “occupancy and other” expenses at BRCB). BRCB recoups that higher expense with much lower labor. It is worth noting that BROS is now increasingly using build-to-suit arrangements, which should increase their C/C unit level return.
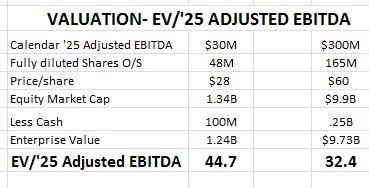
BROS, much further along on their development road, is generating (with our calendar ’25 estimate of $300M) about 10x our $30M estimate of Adjusted EBITDA for BRCB .
The below numbers are LFSI’s compilation of recent operating trends. We have not reconciled the results with all reported period numbers, but believe the results provide a useful broad comparison.
VALUATION COMPARISON AND CONCLUSION
As the chart below shows, BROS, much further along on their development road, is generating 10x the Adjusted EBITDA of BRCB. The Enterprise Value/Calendar ’25 EBITDA is 44.7x with BRCB vs 32.4x with BROS, a 38% premium.
Both companies are growing at about the same pace and generating similar cash on cash unit level returns (considering that BROS from this point forward is employing more leverage). A positive possibility for BRCB is that buildout from an earlier stage could leverage their G&A, growing earnings and cash flow per share more rapidly than BROS. There is also the possibility that all locations, early and later entries, highest and lowest volumes, could take a major leg upward as consumer awareness of BRCB builds.
However, the 38% premium accorded to Black Rock may adequately value the comparative upside possibility. It may be at least as likely that new markets respond more slowly than hoped. We see no particular flaw in Black Rock’s strategic plan but it concerns us that Dutch Bros will have preceded Black Rock geographically, with much greater unit density, almost everywhere. Overall: at a lower valuation, with a similar unit growth rate as well as unit level and corporate economics, we would rather bet on relatively “de-risked” and first mover, Dutch Bros.
Roger Lipton
The following operational statistics are LFSI’s compilation of recent operating trends. They are not reconciled with results from a specific period but provide an approximate comparison of most important operating line items. Demonstrated are the much lower labor at BRCB, which offsets the much higher Occupancy and Other (because of build-to-suit leverage), the higher CGS at BRCB which may reflect more recent promotion that have likely aided SSS comparisons).

BLACK ROCK COFFEE BAR LOCATIONS DUTCH BROS LOCATIONS & AUVs
BLACK ROCK VOLUMES BY STATE