



The political season is really heating up, and there will be a lot of rhetoric from both sides about immigration and abortion and inflation and infrastructure spending and job creation and other subjects. There will also be reference to the increasing debt burden and both sides are already promising to control the deficit, and in turn the debt, which is now costing US taxpayers almost one trillion dollars per year in interest expense. Both sides are claiming that the others are responsible for what we call the “fiscal promiscuity” which has been in place for decades.
It seems like a good time to get a few facts on the table, and the Table we show just below provides the reality of the situation.
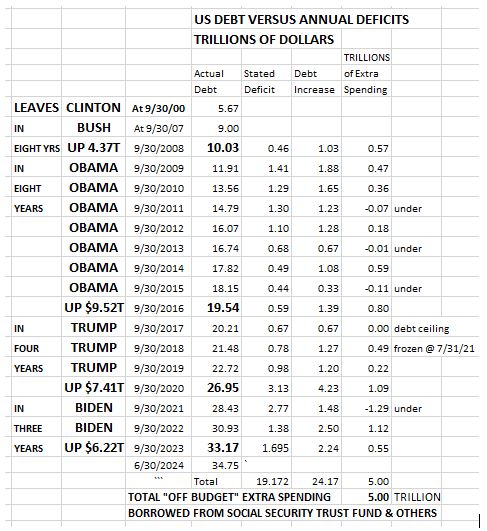
THERE IS A LOT OF INFORMATION IN THE TABLE ABOVE
GW Bush inherited a debt burden of $5.67 trillion from Bill Clinton at the end of ’00, and with the help of two wars, the dotcom bust, the economic uncertainty surrounding Y2K, and Alan Greenspan’s money creation which financed the governmental spending binge, built the debt by $4.33 trillion to $10.03 trillion by the end of his term in late ’08.
Barack Obama campaigned in ’08, chastised Bush and the Republicans for their fiscal/monetary irresponsibility, then proceeded to boost the debt by $9.52 trillion during his eight years. To be sure, there were lots of good reasons why this was necessary, not the least of which was the “great recession” of ’07 – ’08 which he inherited, but the facts remain.
Donald Trump campaigned in ’15, chastised Obama and the Democrats for their lack of financial control and proceeded to boost the debt by $7.41 trillion during his four years. To be sure, there were lots of good reasons why this was necessary, not the least of which was the pandemic, but the facts remain.
President Biden campaigned in ’20, promising that a Biden administration would build the economy from the bottom up and reduce deficits accordingly, and has proceeded to increase the debt by $6.22 trillion in three years ending 9/30/23 and another $1.6 trillion since then. To be sure, there were lots of good reasons, why this was necessary, not the least of which was the portion of the pandemic that he inherited, but the facts remain.
It is also worth noting that, as the table above also shows, the debt has increased over the last fifteen years by about $5 trillion more than the annual deficits would imply. This is a result of “off budget” spending, and these dollars are borrowed from a variety of government “slush funds”, the most prominent of which is the Social Security “lockbox”. This incidental “technical” fact of life, worth about $5 trillion, seems like a material distortion to us.
GDP GROWTH HAS BEEN ANEMIC FOR TWO DECADES
The following table shows annual calendar US GDP real GDP growth since the DOTCOM period of 1999 to 2000. You can see that, excluding 2009 (the great recession), and 2020-2021 (the pandemic & recovery year): average GDP growth was 2.7% from ’99 to ’08, 2.3% under President Obama, 2.7% under President Trump and 2.2% under President Biden. An argument can be made that these “real” growth numbers, adjusted by the increases in the reported Consumer Price Index, are overstated because the annual CPI increases are understated.
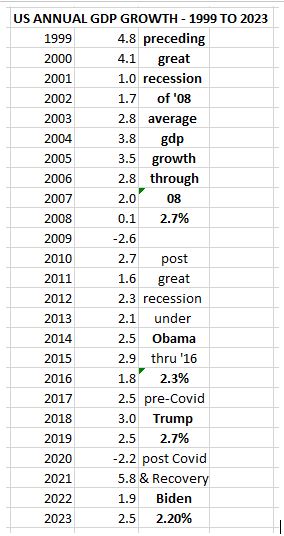
It is obvious from the facts above that both political parties are seriously overstating their success. Under President Obama, even including the strong bounce back year of ’10, real GDP growth averaged 2.3% during the last seven years (excluding the Recession of ’09) of his presidency. Under President Trump, in spite of lower taxes, less of a legislative burden, repatriation of trillions of overseas dollars, interest rates close to zero and a generally friendly business climate, real GDP growth averaged about 2.7% pre-Covid, only about 0.4% higher than under the previous administration. This lackluster result has continued the last three years (post-Covid) under President Biden, averaging only 2.2% after the 5.8% bounce back year. The economy has not improved in Q1’24, running only an annualized 1.4%. This twenty year trend is what economic PHDs call a “diminishing marginal return on incremental investment”, the investment being trillions of dollars of deficit spending.
THE DEBT MATTERS – NOT AN ABSTRACTION
With the above facts before us, we should remember why the debt matters. Any economic entity, be it an individual, family, business or government has a difficulty being productive if they are carrying a large debt burden. Common sense dictates that capital expended to service debt leaves that much less for productive pursuits. In 2011 noted economists, Carmen Reinhart and Kenneth Rogoff wrote “This Time is Different: Eight Centuries of Financial Folly”. They suggested that when government debt gets above 80-90% of GDP, an increasing burden on GDP growth is the result. Our debt, at $35 trillion, is now at about 125% (and rising) of our annualized $28 trillion GDP. This is one large reason why US real growth will continue to be hard to come by. Considering that the debt is increasing by $2.5 – 3.0 trillion annually (about 7% of the current $35 trillion), a great deal more than the 2-3% the GDP is growing, this burden can only be expected to increase.
CONCLUSION
As we listen to the political promises regarding the deficits and the debt, consider that: in the last 43 years, since the cumulative debt was about $1 trillion under Ronald Reagan in 1980, there have been only four surplus years: three under President Clinton, and the first under GW Bush. The cumulative surplus in those four years was about $750 billion. Therefore: in 43 years, through “booms and busts”, political and military and social upheaval, a technology revolution and a pandemic, stimulated by almost $40 trillion of money creation, there were only 4 relatively immaterial surplus years. This backdrop does not suggest that our worldwide politicians and bankers can gracefully extricate us from this situation.
In terms of managing one’s liquid assets, since nobody can predict what the “end game” will look like or its timing, aside from staying as physically and emotionally as healthy as possible, we suggest staying financially liquid and flexible. We personally have a substantial portion of our assets in short term US Treasury securities, with much less in traditional equities. By far the largest portion of our liquid assets remain in high quality gold mining equities.
Roger Lipton