

IT’S ALL ABOUT THE RETURNS
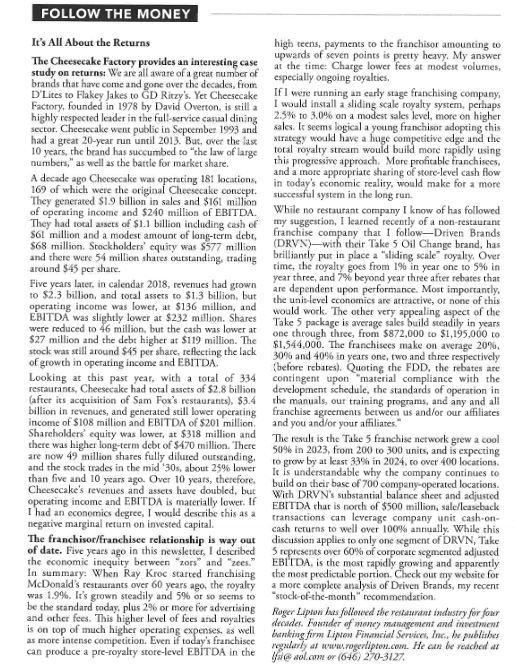
Cheesecake Factory provides an interesting case study: We are all aware of a great number of brands that have come and gone over the decades, from D’Lites to Flakey Jakes to GD Ritzy’s and a hundred others we could name. Equally interesting today is a performance review of Cheesecake Factory, still a highly respected leader in the full-service casual dining sector. Founded in 1978 by David Overton, going public in September 1993, CAKE had a great twenty year run until 2013, but over the last ten years has succumbed to “the law of large numbers” as well as the battle for market share. A decade ago – in 2013 – CAKE was operating a total of 181 locations, 169 of which were Cheesecake Factories. They had generated $1.878B in sales, with $161M of operating income and $240M of EBITDA. They had total assets of $1.124B with cash of $61M versus long term debt of a modest $68M. Stockholders’ equity was $577M and the 54M shares were trading around $45/share. Five years later, in calendar ’18, revenues had grown to $2.332B, and total assets to $1.314B but operating income was lower, at $136M, and EBITDA was slightly lower at $232M. The shares had been reduced to 46M, but the cash was lower at $27M and the debt higher at $119M. The stock was still around $45/share, reflecting the lack of growth in operating income and EBITDA. Most recently, at 12/31/23, with a total of 334 restaurants, CAKE had total assets of $2.84B and $3.43B in revenues, had generated still lower operating income of $108M and EBITDA of $201M. Shareholders’ equity was lower, at $318M, against higher long-term debt of $470M. There are 49M shares fully diluted, and CAKE stock trades in the mid 30s, about 25% lower than five and ten years ago. Over ten years, therefore, CAKE’s revenues and assets doubled, but operating income and EBITDA has been materially lower. If we had an economics degree, we would describe this as a negative marginal return on invested capital.
DRIVEN BRANDS IS WRITING A NEW BOOK ON FRANCHISING WITH “TAKE 5 OIL CHANGE”
The franchisor/franchisee relationship is way out of date. Five years ago, on 3/11/19, we described on our website the economic inequity between “zors” and “zees”. In summary: When Ray Kroc started franchising McDonald’s restaurants over 60 years ago, the royalty was 1.9%. It has grown steadily and 5% or so seems to be the standard today, plus 2% & more for advertising and other fees. This higher level of fees and royalties is on top of much higher operating expenses as well as the obviously much more intense competition. Even if today’s franchisee can produce a pre-royalty store level EBITDA in the high teens, payments to the franchisor amounting to upwards of 7 points is pretty heavy. Our answer: lower fees at modest volumes, especially ongoing royalties. If I were running an early-stage franchising company, I would install a sliding scale royalty system, perhaps 2.5-3.0% at a modest sales level, more on higher sales. It seems logical that a young franchising company adopting this strategy would have a huge competitive edge and the total royalty stream would likely build more rapidly using this progressive approach. More profitable franchisees, and a more appropriate sharing of store level cash flow in today’s economic reality, would make for a more successful system in the long run.
While no restaurant company we know of followed our suggestion, we learned recently that one of the non-restaurant franchising companies that we follow, (Driven Brands) (DRVN) – with their Take 5 Oil Change brand – has brilliantly put in place “a sliding scale royalty over time” – from 1% in year one to 5% in year three, (7% beyond year three) after rebates that are dependent upon performance. Most importantly, the unit level economics are attractive, or none of it would work. The other very appealing aspect of the Take 5 package is that average sales build steadily in years 1 through 3, from $872k to $1,195k to $1.544k. The franchisees make, on average, 20%, 30% and 40% in years 1, 2 & 3 respectively (before rebates). Quoting the FDD, the rebates are contingent upon “material compliance with the Development Schedule, the standards of operation in the Manuals, our training programs, and any and all franchise agreements between us and/or our affiliates and you and/or your affiliates.”
The result is that the Take 5 Oil Change franchise network grew a cool 50% in ’23, from 200 to 300 units, and is expecting to grow by at least 33% in ’24, to over 400 locations. It is also understandable why the Company continues to build on their base of 700 company operated locations. With DRVN’s substantial balance sheet and Adjusted EBITDA that is north of $500M, sale/leaseback transactions can leverage company unit C/C returns to well over 100% annually. While the above discussion applies to only one segment of DRVN, “Maintenance”, this represents over 60% of corporate segmented Adjusted EBITDA, is the most rapidly growing and apparently the most predictable portion. See our website for a more complete analysis of Driven Brands (DRVN), our recent “stock of the month” recommendation.
Roger Lipton